
October 11, 2012
I don't like smart meters (a type of electric power meter). I do not like the idea that the power company can tell me when to use electricity, when and how I've used that electricity, or that the power company broadcasts my electricity usage via a wifi signal, which could be viewed by anyone with the technical skill to break the password. A thief could obtain the password to the smart meter's wifi network, view the pattern of usage and determine when I and my family are home / away or active / inactive (asleep), then rob my house accordingly. Having been robbed twice in my life (neither occasion via this method), it is an issue that matters to me on a personal level.
Another concern held by some is that smart meters, in broadcasting a wifi signal, are a source of constant exposure to electromagnetic (EM) radiation and therefore a health risk. Some people believe they are sick due to exposure to electromagnetic fields (EMFs). The problem is that this may be a form of hypochondria- people who claim to be suffering symptoms from EMF exposure may be imagining it. Personally, I have never been able to shake the thought that these people are in tinfoil hat territory. Maybe they are really getting sick due to EMF exposure, and maybe they are imagining it.
I want to study EMF exposure because I want to try to separate some of the wheat from the chaff or, as Penn and Teller would call it, the facts from the b....... It is beyond the scope of these studies and beyond my personal resources (it would cost too much) to determine the answers to the big questions, such as: Does exposure to EMFs cause sickness? Does the EMF exposure we encounter in our daily lives pose a health risk?
What I intend to study is the level of EMF exposure from devices people are likely to encounter in their daily lives. How much exposure are we getting from a wifi router, a microwave oven, a cell phone, etc.? I will not be providing any interpretations / value statements (what does this mean?, am I safe?, etc.), but I will try to provide, in at least a semi-rigorous fashion, some hard data (how much EMF exposure are we getting from this source vs that source).
My primary tool will be an Extech EMF meter (model 480836), which senses EMFs in the 50 MHz to 3.5 GHz range. The frequency range means I will be studying EMFs in this frequency range (wifi signals, microwave ovens, etc.), but not EMFs in lower ranges (power lines) or higher ranges (airport see-through-your-clothes scanners). I thought it would be interesting to write to the TSA and request permission to take my meter through one of these scanners and measure how much of an EMF we are being exposed to, but these scanners operate in the terahertz range, which is beyond the Extech 480836's abilities. I will start by measuring devices immediately available in my home, possibly branching out later to other sources away from my home.
I am including a bit about my personal background in order to allow the reader to judge any personal bias on my part that may affect these studies. I have a bachelor's degree in math and a master's degree in education. I have no background in electrical work. I understand the basics (volts, amps, and so on), but I am neither an electrician nor qualified to teach anything related to electricity.
Some Informal Research
While the purpose of these studies isn't to determine what safe and unsafe, good and bad, etc., I do at least want some idea of what these numbers should mean to the average person. If the people who want to downplay EMF danger (businesses with a strong financial interest in EMF safety not being a public concern) indicate that EMFs beyond a certain level are cause for concern and I find EMF levels higher than that, then it might be reasonable to conclude the EMF levels I've found are significant (high). On the other end, if I find EMF levels so low that even the most strongly anti-EMF people find those levels acceptable, then it might be reasonable to conclude the EMF levels I've found are insignificant (low).
My informal research consists largely of looking around online for sites, articles, and pages that talk about EMF exposure levels. One purpose of this research will be to generate a chart to gain perspective on the sensor data. Another purpose will be to explore the general perceptions of and information available to the public about EMFs.
The sites, articles, and pages below are presented in the order in which I found them by chance. They are not sorted in any order of preference, importance, etc..
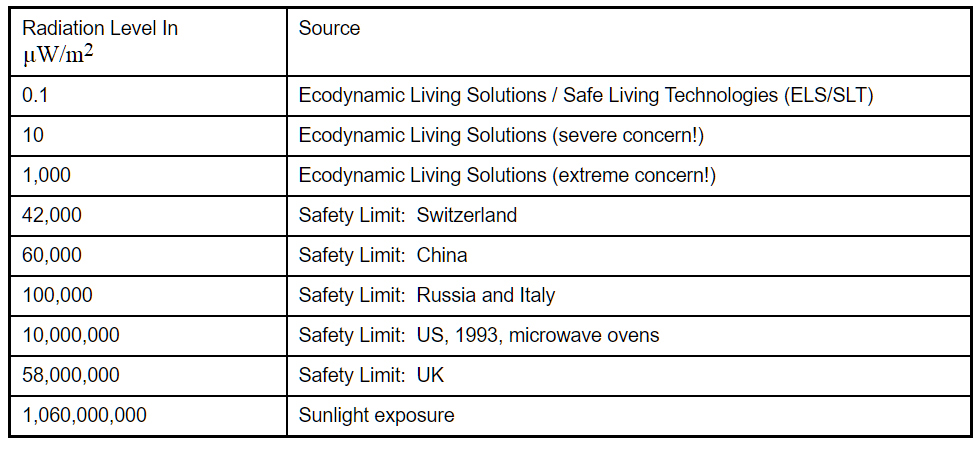
This page (http://www.safelivingtechnologies.ca/EMF_Safety_tips.htm ) lists a number of safety tips about EMFs, some on the reasonable end of the scale (avoid living near cell towers) and some on the less reasonable end of the scale (avoid microwaved foods). This is where I found the levels of 1 microwatt per square meter, 0.1 microwatt per square meter, 0.2 milligauss, 1,000 millivolts per meter, 10 millivolts per meter, and 1 milligauss.
There is a conflict, however, with the Bau-Biologie safety standards listed at the link above and athttp://www.electrosmogsolutions.ca/. Whereas Safe Living Technologies lists safety levels of 1 μW/m2 and 0.1μW/m2, Electrosmog Solutions lists safety levels of 1 W/m2 and 0.1 W/m2. These levels disagree by a factor of 1 million.
This page (http://ecodynamiclivingsolutions.com/guidelines/) lists several different types of safety levels, including EMF levels of 0.1μW/m2, 10 μW/m2, and 1,000μW/m2. This appears to line up with the Safe Living Technologies value of 0.1μW/m2 listed above. I have some misgivings, however, as none of these sites references who/what/where the Bau-Biologie safety levels are coming from. Note that Ecodynamic Living Solutions is in the business of selling home consultations and remodeling and construction services. In other words, Ecodynamic Living Solutions has a vested financial interest in making the homeowner as afraid as possible.
This page (http://en.wikipedia.org/wiki/Sunlight) is the Wikipedia page for sunlight. This page indicates that the amount of radiation the Earth receives, at ground level (not above the atmosphere), from the sun is around 1,060 W/m2.
This page (http://www.safelivingtechnologies.ca/Conversion_Tables.htm ) has conversion tables from microwatts per square meter to microwatts per square centimeter and from gauss to tesla.
This page (http://www.emwatch.com/emf-meter-emf-detector.htm ) has a link to an Excel file with the site's safety scale, including 1 milligauss, 2 milligauss, 5 milligauss, 6 millivolts per meter, 50 millivolts per meter, and 300 millivolts per meter.
This page (http://emf.mercola.com/sites/emf/emf-dangers.aspx ) talks about a 1990 EPA report recommending that EMFs be classified as a class B carcinogen (cancer causing agent), along with the likes of DDT and formaldehyde. The page indicates that, in the final version of the report, EMFs were not classified as a class B carcinogen but also that several studies showed a consistent pattern of response, suggesting a causal link between EMFs and leukemia, lymphoma, and cancer of the nervous system. The page hints that this (the change in decision whether or not to classify EMFs as a class B carcinogen) was the result of lobbying by utility companies, computer companies, and the military. Classification details aside, this does appear to be referencing a clear statement on the part of the EPA that EMFs are dangerous. This page references a Swedish safety standard of 0.25 milligauss for computer monitors and a 1993 US safety limit for microwave ovens of 1 milliwatt per square centimeter (equivalent to 10,000,000 microwatts per square meter). I checked the conversion by hand, but I also tried it on Google. If "1 milliwatt per square centimeter in microwatts per square meter" (without quotes) is entered, Google is smart enough to do the conversion. A Russian safety limit of 0.01 milliwatts per square centimeter (two orders of magnitude more stringent) is also mentioned. The page indicates that electric hair dryers and razors emit EMFs as high as 200 milligauss to 400 milligauss. Other safety levels of 0.5 milligauss and 3 milligauss are also mentioned, but in connection to low frequency EMFs (not the high frequency kind detected by my meter).
This page (http://microwavenews.com/epa.html ) contains the summary of the 1990 EPA draft report on EMFs, as published in the May/June 1990 issue of Microwave News. Note that this is not the final report summary, but the draft report summary. The report talks about low frequency EMF exposure, not the high frequency EMFs I will bet studying. In section 7.4 (Animal Carcinogenicity Evidence) the report talks about two studies (Szmigielski et. al., 1982 and Spalding et. al., 1971) involving exposure of high frequency EMFs on mice. The 1982 study showed that EMF radiation enhances the growth rate of spontaneous mammary tumors (breast cancer) and enhances the growth of skin tumors cause by other carcinogens.
This page (http://www.emfs.info/What+are+EMFs/Terminology/Units.htm ) has a handy conversion chart including micro-teslas, milligauss, and amps per meter.
This page (http://www.emwatch.com/Cellmasts.htm ) suggests moving if there is an EMF at or stronger than 100 millivolts per meter.
This page (http://www.bioinitiative.org/freeaccess/report/docs/section_3.pdf ) cites FCC limits of 27,500 milliamps per meter and 61,400 milliamps per meter (general population vs occupational exposure), although these are the limits for the 30 MHz to 300 MHz range. Cell phone radiation limits are cited as being 10 microwatts per square centimeter in Russia and Italy, and 4.2 microwatts per square centimeter in Switzerland. In the UK the limit is 5800 microwatts per square centimeter. China's safety limit is 6 microwatts per square centimeter. Note that these limits are for cell phones operating in the 800 Mhz to 900 Mhz frequency range and refer to average exposure (not intermittent, spiked exposure).
This page (http://www.createhealthyhomes.com/emf_meters.php ) talks about EMF meters and instruments. This is where I got the levels of 10 microwatts per meter squared and 100 microwatts per meter squared. This page talks about smart meters and pulses (micro-bursts) of EMF vs continuous EMFs.
This page (http://www.icnirp.de/documents/emfgdl.pdf ) is the 1998 International Commission On Non-Ionizing Radiation Protection (ICNIRP) For Limiting Exposure To Time-Varying Electric, Magnet, And Electromagnetic Fields (Up To 300 GHz). This report talks about one mechanism in which EMFs can affect health. The temperature in a person's body can be raised from a fraction of a degree on up to 2 degree Centigrade by exposure to EMFs. Apparently this causes some difficulty for a person's nervous system as their nervous system tries to maintain even temperatures throughout the body (including the EMF-effected areas), but is confused by the body being the wrong temperature due to EMF effects. This is the page where I got the level of 61,000 millivolts per meter, 160 milliamps per meter, 137,000 millivolts per meter, and 360 milliamps per meter (occupational exposure figures), as well as 28,000 millivolts per meter, 73 milliamps per meter and 61,000 millivolts per meter (general public exposure figures).
The primary tool is an EMF meter, Extech model 480836, a tri-axis meter that senses from 50MHz to 3.5GHz.
The meter is attached to a 1" x 4" piece of wood, along the 1x4's central axis, with the sensing end of the meter sticking out past the end of the 1x4. The piece of wood has 4 holes, each about 1/2" to each side of the central axis of the 1x4. One pair of holes is about 1 1/8" from the forward end of the 1x4 (near the meter). The other pair of holes is 2 7/8" from the back end of the 1x4. This difference (2 7/8" - 1 1/8" = 1 1/2") is there to help account for the center of the sensing apparatus of the meter sticking out 1 1/2" from the end of the 1x4. Each pair of holes is about 1 1/8 " from each end of the 1x4. A screw pushes through each hole towards the side of the 1x4 opposite the meter. On the end of each screw is a wing nut and across each pair of screws is a 2" long 2 hole metal bracket. There is a 3/4" x 3/4" yardstick held against the 1x4 by the 2 brackets. When the wing nuts are loosened the yardstick can be adjusted to stick out a measured distance beyond the meter. When the wing nuts are tightened the yard stick is held in place and can not be moved with any force less than what appears to be likely to break the yardstick. With 10.5" of the yardstick taken up by the mounting brackets, this setup allows a testing distance of 0' to 2' from the center of the meter's sensing apparatus to the end of the yardstick.
There is an alternate 3/4" x 3/4" piece of wood, 6' long instead of 3' long, for measured distances of 0' to 5' from the center of the meter's sensing apparatus to the end of the stick.
The EMF meter operates in several display modes, including instantaneous, maximum, average, and maximum average. Instantaneous mode will be used because it will allow power curves to be generated, whereas the other modes only generate summary information. Instantaneous mode displays a series of readings that change too fast to record based on naked eye observation. In order to record these readings, a video camera will be used to record the meter's LCD display. The recorded video will be played back later at a slower speed in order to allow the readings to be transcribed. The recorder will either be a handheld, palm-sized video camera or a GoPro-style camera attached directly to the 1x4.
In order to prevent movement-inflated readings, the testing rig will be held, by hand, as still as possible. A greater degree of stillness could be obtained by attaching the rig to a fixed stand (like a camera tripod), but the rig will be held by hand due to some of the expected test items (smart meters, internet routers) being attached to walls, poles, etc. in such a way that the desired angles (for holding the rig) could not be reached with fixed stand.
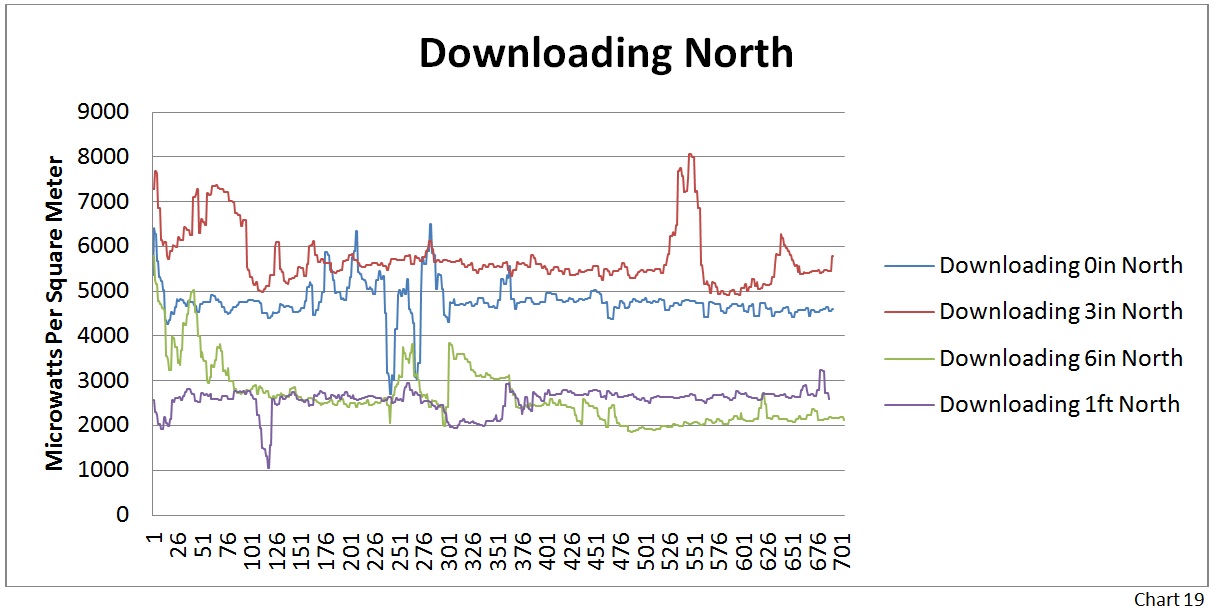
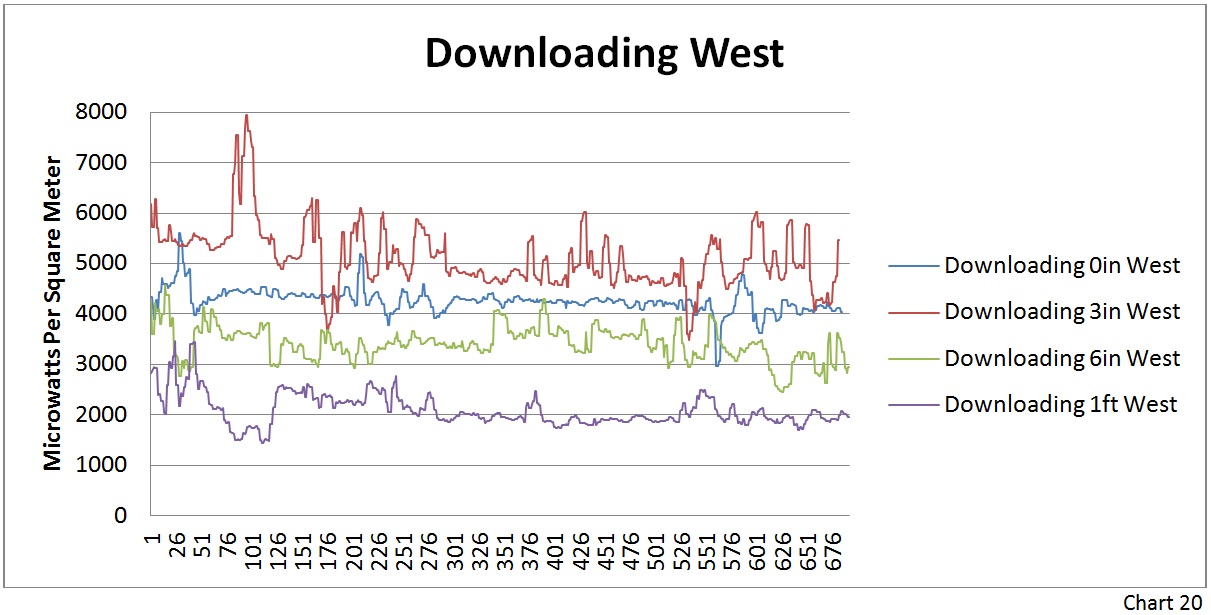
Readings will be taken at multiple distances from the test item, probably 0", 3", 6", 1', and 2', with the yardstick. The 6' stick will either be used of test items that are already outside (such as smart meters) or that are easy to move outside for testing.
Readings will be taken with the test item turned on, but also turned off in order to measure EMF levels that would be present without the effects of the test item. Certain items (such as a smart meter) will have to wait between their initial (powered on) test and their powered off test, due to turning the test items off requiring special circumstances (a power outage in the case of a smart meter).
The manual for the Extech model 480836 EMF meter includes (page 8) a table of calibration factors. The meter is more or less sensitive to certain frequencies. If the frequency is known (such as a microwave oven or wifi router), the calibration factor will be taken into account. Microwave ovens operate at 2.45 GHz, so the listed calibration factor of 1.93 would be used when testing a microwave oven. One table of raw data would be recorded, then another table with all of the readings from the first table divided by 1.93. As listed in the manual, if the frequency is not known, the calibration factor will be 1.0 used, effectively skipping the need to generate a second table for calibrated data.
Readings will be taken at several angles from each test item.
The readings will be recorded by the video camera, then transcribed into a file (most likely Microsoft Excel), then charted (also most likely in Microsoft Excel). If a financially feasible method/program can be found, the transcription process (optical character recognition or OCR, but on video instead of a document) will be automated.
30 seconds of video will be recorded for each test. For transcription, the video will be played back at whatever (slower) speed is needed to allow the readings to be typed into the file.
Testing Rig And Methodology, Revised, October 2, 2012
A single test run was done on an Ipad (Ipad 3, 16gb, wifi only) in order to test the rig. The time length of each test run required either guessing (had it been 30 sec?) or a stopwatch of some kind. An extra mounting platform was attached to the right of the EMF meter. The purpose was to measure the total time of each test run and to serve as a time counter when sensor reading were being transcribed into a spreadsheet.
On reviewing the video of the first test run, it was discovered that the timing between frames on the EMF meter, stopwatch, and video camera did not always line up. The video playback showed many video frames where the EMF meter or stopwatch were in the process of changing from one EMF level / time mark to another. The result was video frames with blurred / overlaid EMF levels and time marks.
In the case of blurred EMF levels, if the outgoing or incoming displayed level showed clear dominance (very dark on the display compared to very light) over the other, the dominant value was recorded. If neither the outgoing nor incoming level was dominant, the incoming level was recorded. This blurring / overlaying happened almost exclusively with single digit values. If, for example, the value was changing from 243.8 to 176.5, the 8 and the 5 might blur / overlay, but the 2 and the 1 would almost never do so. Whichever of the most significant values (2 vs 1 here) was dominant would define which (outgoing vs incoming) total value would be recorded. The blurring / overlaying only became problematic with single digit values, such as a transition from 0.3 to 0.4. In these cases, if neither value appeared dominant, the incoming value (0.4 in this case) would be recorded.
The blurred stopwatch time marks were dealt with differently. The stopwatch was used to mark the overall time (now 70 seconds instead of 30 seconds per run). The stopwatch was not used to mark the individual time marks. The raw video was imported to a PC computer, then opened in the video processing program Avidemux. In Avidemux the video was converted from color to grayscale and cropped to show the EMF display only. The video output format was set to MPEG4 ASP XVID4 in order to be opened in the next program. The cropped video was saved as a separate file from the raw video. The cropped video was then opened in another video processing program (Virtualdub). Virtualdub then saved a screenshot every 0.1 seconds, resulting in 600 JPG images per minute of video. Attempts were made with several optical character recognition (OCR) programs to automatically transfer the screenshots into text, but the reliability of the OCR function was so poor (maybe 3 correct values per 600 screenshots) as to be useless. The screenshots were transcribed by hand.
An EMF meter with a PC-out or memory card recording function was sought, but none were found. There are EMF meters with wider or narrower frequency ranges than the Extech 480836, but none were found with a data-out function.
The Ipad is capable of 802.11 a, b, g, and n wifi connections. The router the Ipad was connected to is a Dlink wireless router, capable of 802.11 b, g, and n wifi connections. The wifi connection between the two should have been 802.11 b, g, or n, but there was no way to tell which was being used. 802.11 b and g both use the 2.4 GHZ frequency range. 802.11 n uses both the 2.4 GHZ and 5.0 GHZ frequency ranges. The Extech 480836 is not capable of sensing the 5.0 GHZ frequency range. The Extech 480846 is capable of sensing from 10 MHZ to 8 GHZ, including the 5.0 GHZ frequency range, but the Extech 480846 was too expensive ($630 on Amazon.com vs $260 on Amazon.com for the 480836) for the scope of this project. The conclusion was that the Ipad was using the 2.4 GHZ frequency range. According to the Extech 480836 manual, the calibration factor is 1.93. All EMF values were recorded as displayed on one sheet in the spreadsheet, then multiplied by 1.93 on another sheet in the spreadsheet. The charts below all use the calibrated data (with the 1.93x multiplier), not the raw data (without the 1.93x multiplier).
The Ipad's EMF output was measured from 5 different directions, for a total of 46 runs of approximately 70 seconds per run.
The 5 directions were South (pointing out in the same direction as the dock connector port), North (opposite to South), West (left if the Ipad is held vertically, with the home button on the bottom and the front camera on the top), East (opposite to West) and Face (straight out from the Ipad's Retina display, orthogonal to the intersection of the South/North and East/West axis). Limitation- The rig was held in each of these 5 directions, centered by sight on each edge/face of the Ipad. It was beyond the scope of this project to build a fixed, adjustable mount for both the rig and the test subject (the Ipad in this case).
The distances were 0", 3", 6", and 12".
The Ipad statuses were powered off, normal (on but not doing any particular task, display blacked out in the manner of a screen saver), and downloading (actively downloading a single file during the entirety of each individual run. In the case of downloading, each download would continue for 2 to 3 full runs, then the file would be deleted, downloading would begin again, and the next 2 to 3 full runs would be recorded. An additional status of Nothing was recorded as a sort of control group. The Ipad was powered off and moved about 40 feet away, inside a building.
The 46 categories were: Nothing, Powered Off South/North/West/East/Face 0", Normal South/North/West/east/Face 0"/3"/6"/12", and Downloading South/North/West/East/Face 0"/3"/6"/12".
Due to the limitations of the equipment used in this project, there is a human factor involved that introduces error. The video camera and EMF sensor do not have the ability to synchronize their timing. Each, in a sense, has its own metronome. The EMF sensor changes the displayed value from one moment to the next, click, click, click (like a metronome). The video camera, in taking video, is taking a series of still photos, click, click, click. The problem is the two metronomes are not in synch with each other. The result is that, every so often, the sensor value recorded by the video camera is in between two values the sensor is actually trying to display. The other source of error is that, due to the lack of a PC interface, the sensor values have to be typed into the PC by a human.
Each run was reviewed for possible sensor value typos. This was done primarily by viewing the charts for each run and looking for spikes, especially sharp, single-value spikes, where there was a single, noticeably higher or lower value. When a possible error was found, the value in the spreadsheet was compared with the screenshot for that sensor value. If there was an error, the correct value was entered.
Below is a 'before and after' example, using the Downloading 6" South category. The blue line (before) is mostly covered up by the red line (after). The 5 locations where a blue spike appears show the errors as the blue spikes.
A better setup would include a PC interface for the EMF sensor, a static mounting apparatus for the testing rig, a controlled environment free from as much background EMF noise as possible, and multiple testing rigs to operate simultaneously. These are beyond the scope (too expensive) of this project, so what errors are present will have to be dealt with as best as possible.
Nothing

The average EMF level for this category was 0.6 microwatts per meter squared (μW/m2). The standard deviation was 0.1μW/m2.
It is possible that some part of the test rig itself (the EMF meter, the stopwatch, the video camera) could be generating this background EMF.
Other possible sources of EMFs in the area include the Ipad (about 40 ft away, inside as opposed the test area which was outside), the Dlink wireless router (about 40 ft away, inside), 1 laptop computer (about 40 ft away, inside), 2 water utility meters (about 20 ft away, about 6" underground, capped with standard concrete cover panels, 3G-capable, essentially water meters with specialized cell phone-type connectivity), another water utility meter (about 50 ft away, across the street), and another wifi router (about 80 - 100 ft away inside another house).

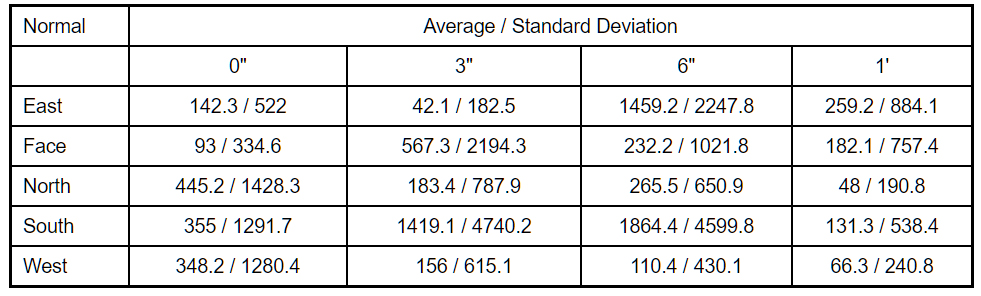
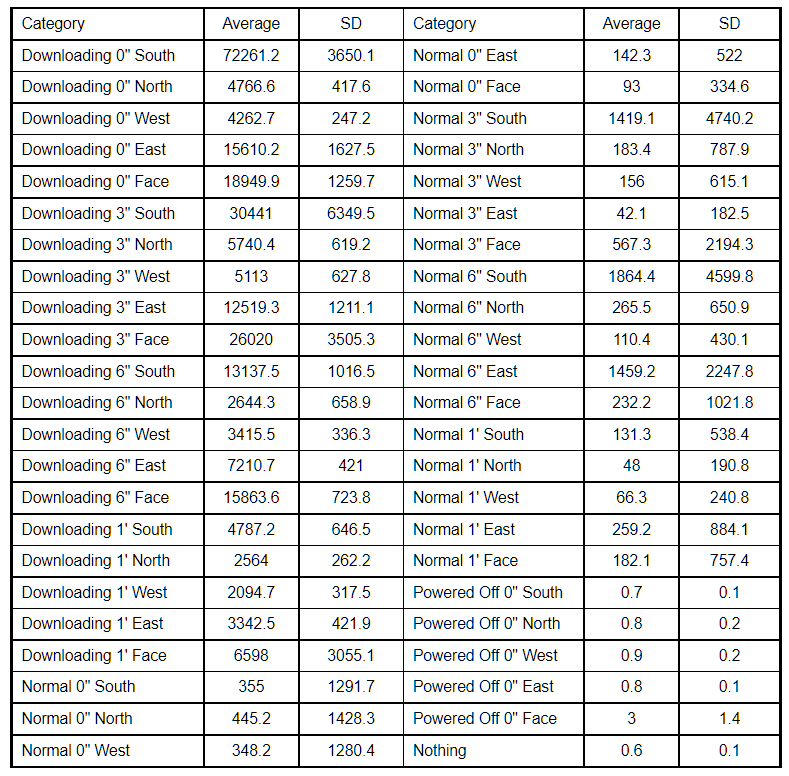
The average EMF levels and standard deviations were as follows. Units are inμW/m2.

If the Ipad was powered off, the Ipad itself should not have been generating an EMF of its own. It is not known whether or not the Ipad, in a powered off state, could serve as a reflector or focuser of other EMF sources in the area. It is also not known to what degree the Ipad powered off state is a truly powered off state (as if the battery was removed, leaving the Ipad with no power at all). Of the 5 runs (East / Face / North / South / West), only Powered Off 0" Face showed EMF levels noticeably different from the Nothing category. Possible explanations for the increased EMF level in Powered Off 0" Face, from about sample 200 on, include the laptop computer inside doing some kind of automatic connection (ex: a Windows update), any of the 3 water meters doing some kind of wireless water usage report, someone in the residence across the street using their wireless network, or some other unknown factor.
In the other, non-powered off categories, the highest EMF levels almost always come from South, not Face. Higher EMF levels coming from the Face category here would seem to indicate an EMF source external to the Ipad.
The Normal category is where the Ipad is powered on but has been left alone enough for the screen to turn off. There is no one interacting with the Ipad at this time.


The average EMF levels and standard deviations were as follows. Units are inμW/m2.
In the Normal category the Ipad appears to be idle and then occasionally a brief period of wifi activity, lasting around 5 to 10 seconds per event. The chart for these events appear similar to the top half of the waveform for a sonar's 'ping.' With these events, as with a sonar's ping, the signal rises sharply and suddenly, then drops off along what appears to be an asymptotic curve. It is not known if this is the result of the Ipad checking in to see if it still has a live connection to the wifi router, or if a program on the Ipad is performing some action with the Ipad's screen off, or if there is something else happening.
 (4 sonar pings)
In the Normal charts above, these ping events do not appear to happen in a consistent fashion, either time-wise or strength-wise. When the signal was recorded for each of these sensor runs, no attempt was made to account for the number of programs that had been opened since the last time the Ipad had been power cycled (turned off, then back on).
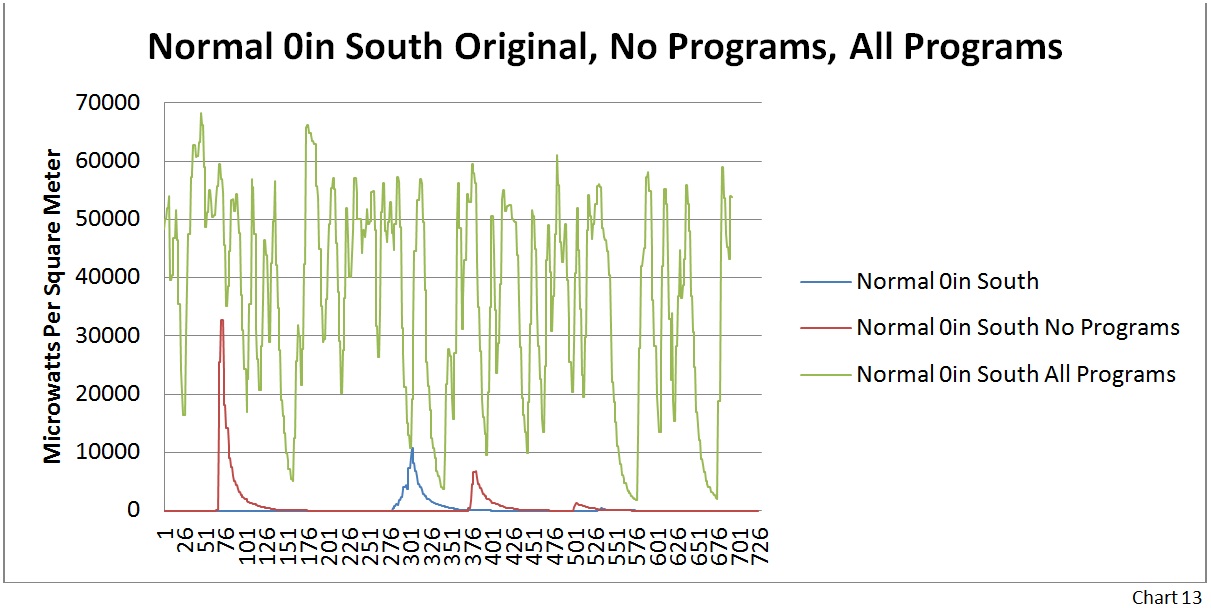
Two additional runs were made, Normal 0" South No Programs and Normal 0" South All Programs. With the No Programs run, the Ipad was powered off, left alone for at least 30 seconds, then powered back on, no programs were loaded, and sensor data were collected. After the No Programs run, each program ('app' in Apple parlance) was loaded, then the home button was pressed. After the last program was loaded and the home button was pressed for the last time, the Ipad was left alone long enough for the screen to black out again. The next test run (All Programs) was performed.
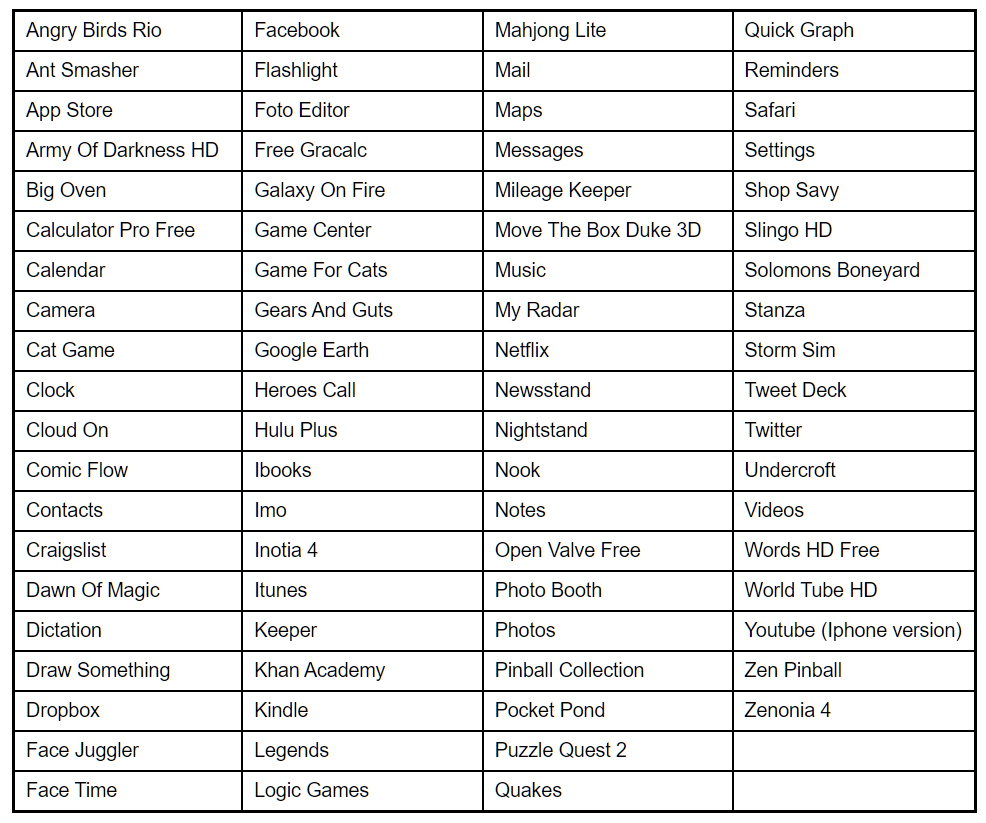
This is a list of the programs that were run under Normal 0" South All Programs. Where a name appears to be generic (ex: Maps), that is the displayed name of the program that came with the newly purchased Ipad.
The chart below includes Normal 0" South No Programs, Normal 0" South All Programs, and Normal 0" South (the original Normal 0" South shown above).
The average EMF levels and standard deviations were as follows. Units are inμW/m2.

The difference between Original and No Programs vs. All Programs is noticeable and extreme, at a factor of roughly 50 for the averages and roughly 10 for the standard deviations. In order to keep the comparison toward the serious end of the scale (casual vs. serious) research-wise, the original Normal categories (0", 3", 6", 1') should all be re-done with the number of programs controlled. All of the original Normal categories (accept 0" South) would be re-tested with the Ipad in a No Programs state. This will not be done at this time, but may be done later as an addendum to this project. The categories of Nothing and Powered off will not be affected by the number of programs running because, in both of these categories, the number of programs running is fixed at 0. The number of programs running in the Downloading category should not be an issue because the Ipad generally does not appear to download more than one file at a time. When multiple programs are selected for installation from the App Store, the Ipad downloads and completes installation of one program before beginning to download the next program.
In almost all of the Normal charts above, the ping events are quite evident. The All Programs category varies suddenly, repeatedly, and over a wide range. One possible explanation is that different programs on the Ipad trigger ping events to varying degrees. The chaotic appearance of All Programs may be due to a large number of ping events overlaying onto each other.
The Downloading category is where the Ipad is actively downloading a file during each (roughly-) 70-second run. A free program with a large file size was selected in the App Store. The program began the installation process, which appears as follows. The program icon appears on the Ipad desktop. The program begins downloading with the word 'downloading' displayed below the icon. Installation (with the word 'installation' replacing the word 'downloading') begins once downloading is complete. Once installation is complete and the word 'installation' disappears, the program is ready to run. The Ipads screen was on during each run in order to monitor whether or not the Ipad was downloading throughout the run. If the screen dimmed (prior to going black) during a run, an inactive part of the Ipad desktop was pressed in order to keep the screen on. 2 to 3 runs were completed before the program went from downloading to installation. The program was deleted, then told to again download and install. Another 2 to 3 runs were completed. This process was repeated until all of the runs in the Downloading category were completed.
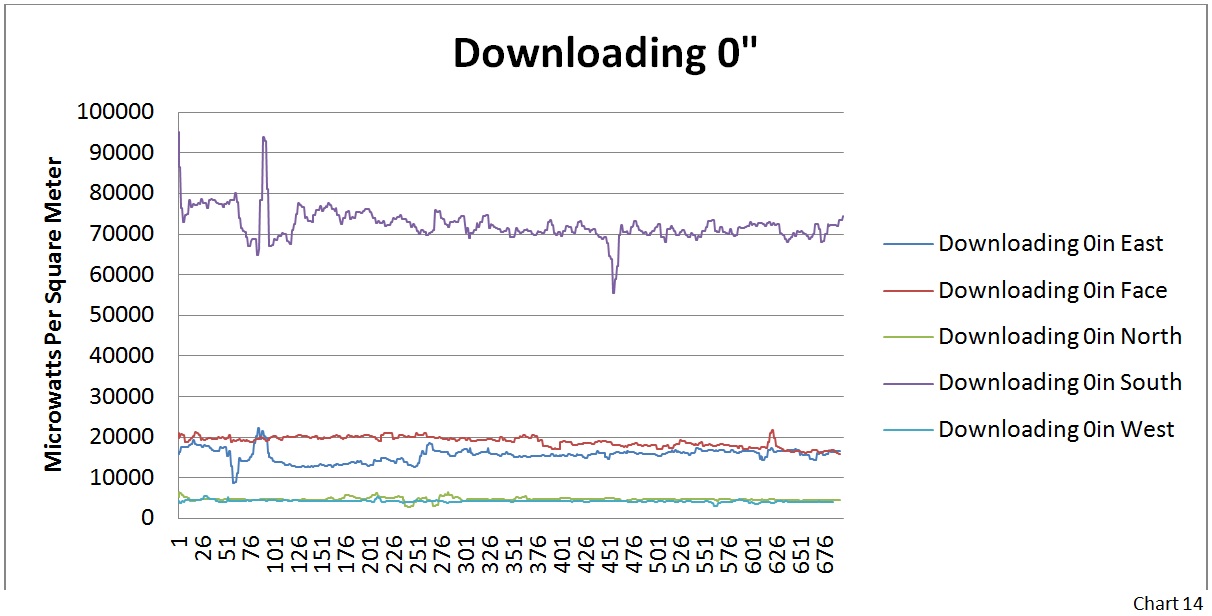


The average EMF levels and standard deviations were as follows. Units are in μW/m2.

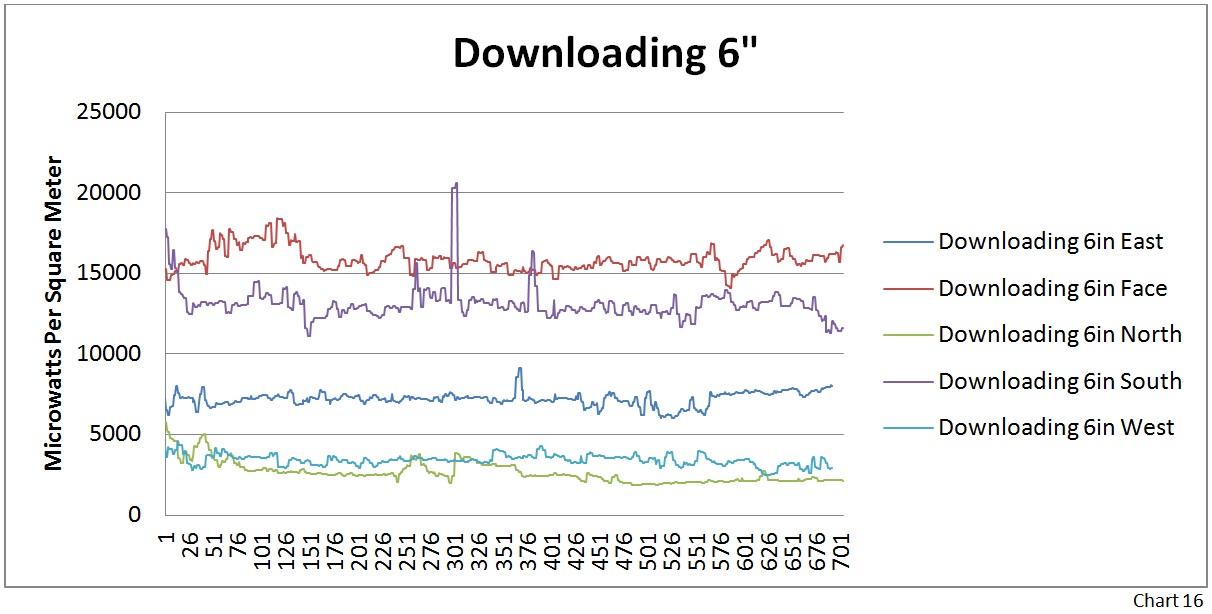
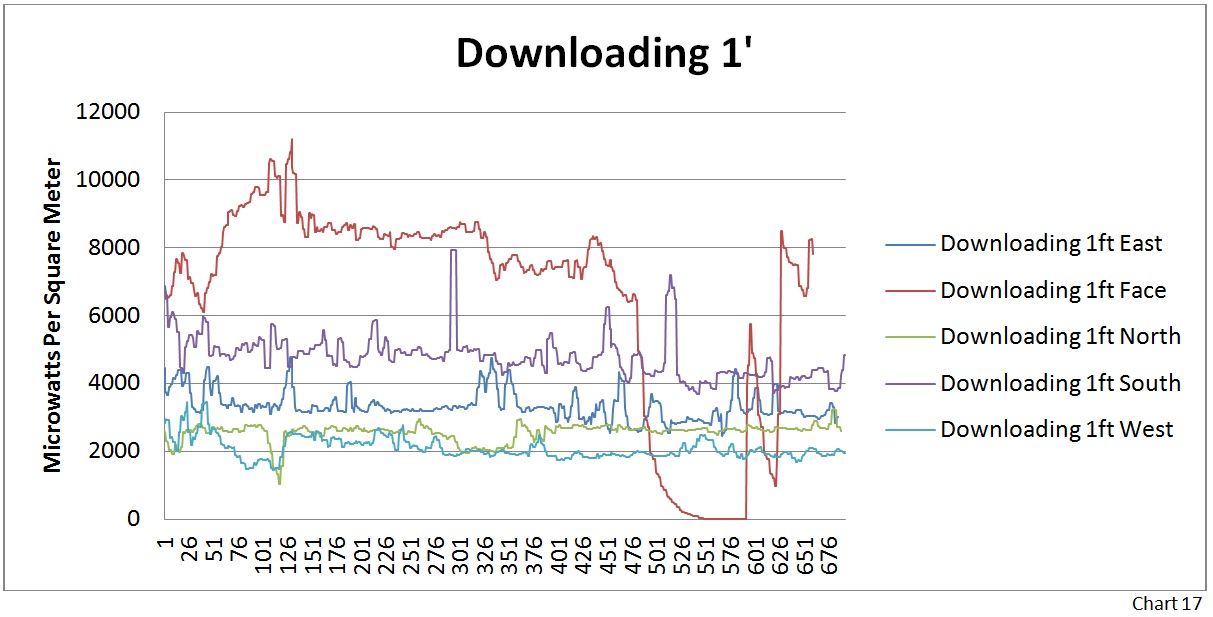
Downloading 0" South was, by far, the category with the highest values for the entire Ipad test. It has a fairly stable looking sustained value (not just average) of around 72,000μW/m2. If you rest the bottom (South) edge of the Ipad on your stomach either in a sitting position or lying on your back, this is the part of the Ipad touching your stomach. See below for discussion regarding safety levels.
Downloading 3" South has a noticeable drop off beginning around value 650. Downloading 1' Face has a noticeable drop off from around value 475 to value 580. There are several spikes that remain in the Downloading charts even after checking the spike values against the screenshots.
Here are the radiation levels from the Informal Research section above.
Here are the averages and standard deviations (SDs) for all 46 categories, not including Normal 0" South No Programs, Normal 0" South All Programs, Downloading 6" South Before, and Downloading 6" South After.
How certain are these averages? The average for Downloading 0" South appears to be 72,261.2μW/m2, but how certain is that average? A 'confidence interval' is a way of making statements about how certain it is that the true average is above or below a certain amount. A confidence interval makes it possible to say things like 'there is a 95% chance that the true average of Downloading 0" South is equal to or less than ??,???μW/m2. The table below includes the number of sensor values in each run (n) and the upper value for the confidence interval (99.99% confidence, alpha = 0.001, computed in Microsoft Excel 2007).
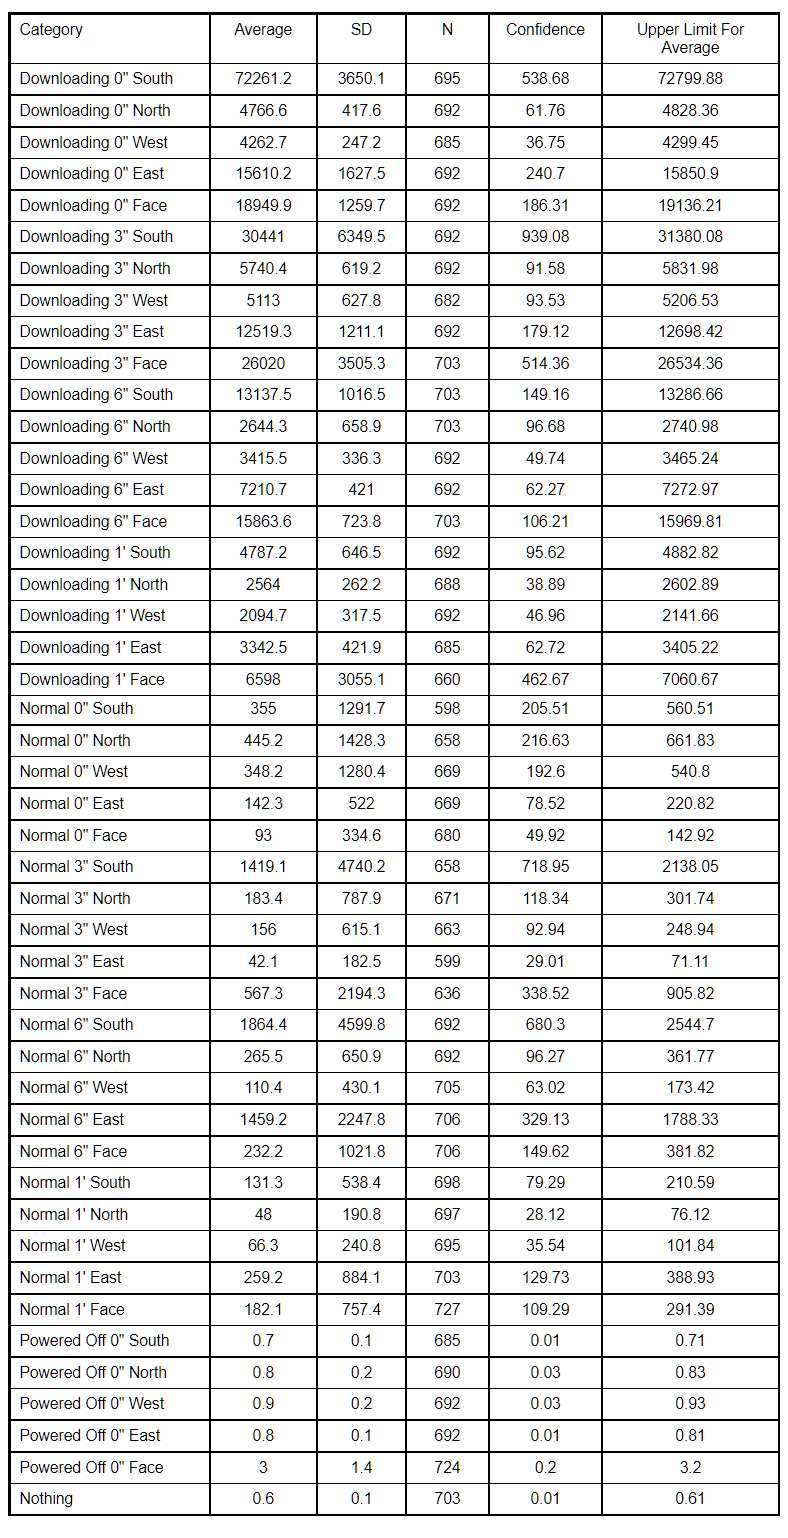
The table below shows the 46 categories, the upper limit averages (Upper Average), sorted by Upper Average. Highlighted rows are included for the 9 safety limits and sunlight. Units are inμW/m2.

Sunlight: The radiation we are exposed to by the sun is around 10,600,000,000 times the 0.1μW/m2 safety levels recommended by ELS/SLT and around 1,060,000 times the 1,000μW/m2 ELS describes as being cause for extreme concern. This comparison is included as a matter of perspective, but is not meant to be a straight apples-to-apples comparison. Sunlight (at around 5 * 1014 Hz) is at a frequency about 200 times higher than that of the radiation coming out of a microwave oven (at around 2.5 * 1012 HZ). Increasing exposure to sunlight will lead to tanning and eventually skin cancer. Increasing exposure to radiation coming out of a microwave oven will lead to cooking (just like what happens to the food inside the oven).
If a person sleeps within and EMF with a level of 1,000μW/m2 (extreme concern!) for 8 hours, they will be exposed to the same amount of radiation by being out in the sunlight for about 0.027 seconds (8 hrs * 60 min / hr * 60 sec / min, divided by 1,060,000). In the few seconds a person spends walking from their front door to their car for work each morning, they are exposed to several hundred times the amount of radiation that ELS would have you believe is cause for extreme concern. One might conclude that, if you find a $5 bill on the sidewalk, you won't be too worried about missing the penny in the gutter.
Looking at the national safety limits, the Ipad is, in all categories, well under all of the national safety limits accept for Downloading 0" South, which is above the Swedish and Chinese safety limits. Comparing the US 1993 safety limit for microwave ovens to the category (Downloading 0" South) with the highest average, the Ipad is still below the safety limit by a factor of about 138. That means a person would have to have 138 Ipads, all downloading at the same time, sitting directly against the person's skin, to approach the safety limit.
Digital pulsed signals. Using Downloading 0" South as an example, if the EMF was the result of a continuous, smooth dose of radiation at 72,261.2μW/m2, that would mean the effective 'punch' of the radiation's impact / the EMF strength would always be 72,261μW/m2. As the charts above show, the EMF strength coming from the Ipad varies greatly and is almost never constant. The highest value /pulse in the entire test was 95,033.2μW/m2, the first value in Downloading 0" South. The Ipad might be capable of emitting a stronger EMF, but looking at this highest tested EMF level does not change the Ipad's position on the table above. It's still above the Chinese safety limit and still below the Russian and Italian safety limits.
The Ipad does exceed the safety limits used by Ecodynamic Living Solutions and Safe Living Technologies, but this still needs to be taken with a grain of salt as both ELS and SLT are in the business of selling their services based on fear of EMFs. This does not mean the ELS / SLT safety limits are invalid. Salesmen sometimes tell the truth. However, due to the extreme difference (12 orders of magnitude, or a factor of around one billion) between what ELS / SLT say is safe and the radiation dose a person gets by walking outside in the daylight, it would seem that there is not a great deal of benefit to be had by worrying about the levels cited by ELS / SLT. If a person is going to let their child play in the water, but only in the kiddie pool with the 2' high water level, that person should probably not worry too much whether or not another drop of water has been added to the pool.
What conclusions can be reached about the Ipad 3?
The EMFs emitted by the Ipad appear to all be well below all of the national safety limits, accept for the Swiss and Chinese safety limits, which are only exceeded when the Ipad is actively downloading and the bottom of the Ipad is held directly against the skin. If a person wants to download a large file on the Ipad while also staying below the Swiss and Chinese safety limits, that person can set the Ipad down for a couple of minutes and everything will be fine.
The final result appears to be that, in almost all cases, the Ipad 3 does not exceed any unbiased safety standards.